

Documentation

8.2. Interface Structure

Updated 31 August 20261 min read

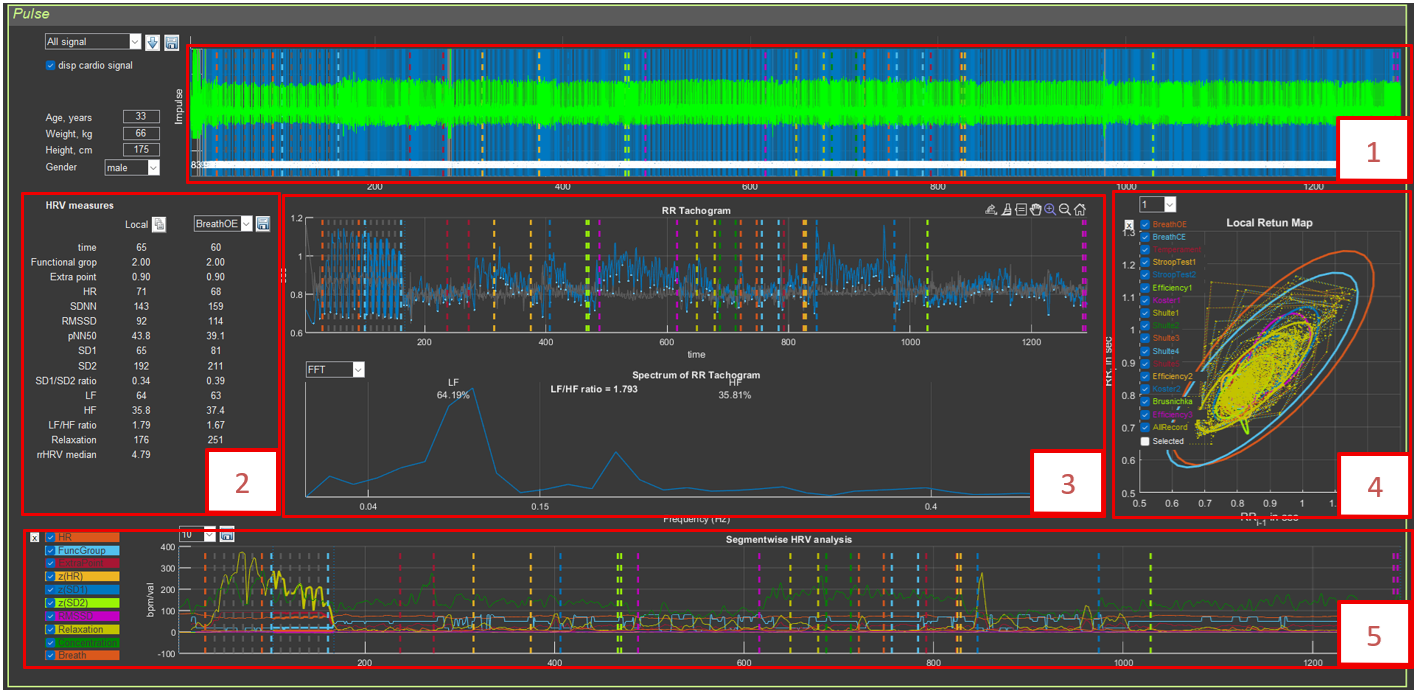
Full Cardio domain interface layout with five numbered regions: the raw pulse/ECG signal display (1), HRV measures table (2), RR tachogram and spectrum panel (3), Poincaré Local Return Map (4), and segmentwise HRV analysis chart (5).

The interface contains:

  1. Top panel: visualization of pulses and RR intervals
  2. Middle left panel: HRV parameter table
  3. Middle center panel: RR tachogram and spectrum
  4. Middle right panel: Poincaré plot (Local Return Map)
  5. Bottom panel: segmental HRV analysis