

The lower graph shows the original signal in the time domain with the same transformations (Trim, CAR, Denoise, IMF) as the spectrogram, but without frequency filtering. Denoise is used to suppress blink artifacts.
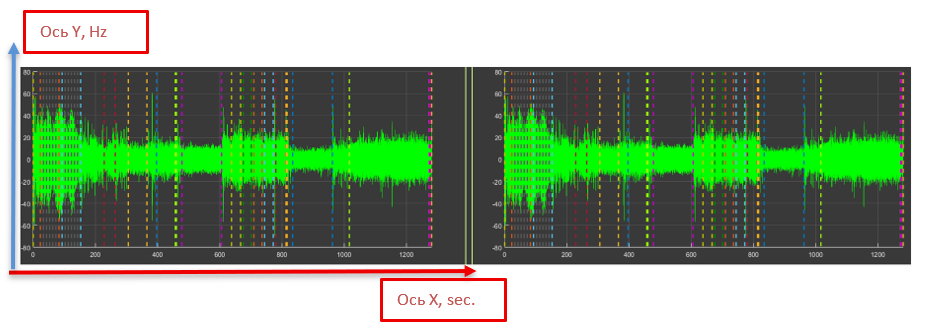
The lower graph shows the original signal in the time domain with the same transformations (Trim, CAR, Denoise, IMF) as the spectrogram, but without frequency filtering. Denoise is used to suppress blink artifacts.