Documentation

4.2. Interface Structure

Updated 31 August 20261 min read

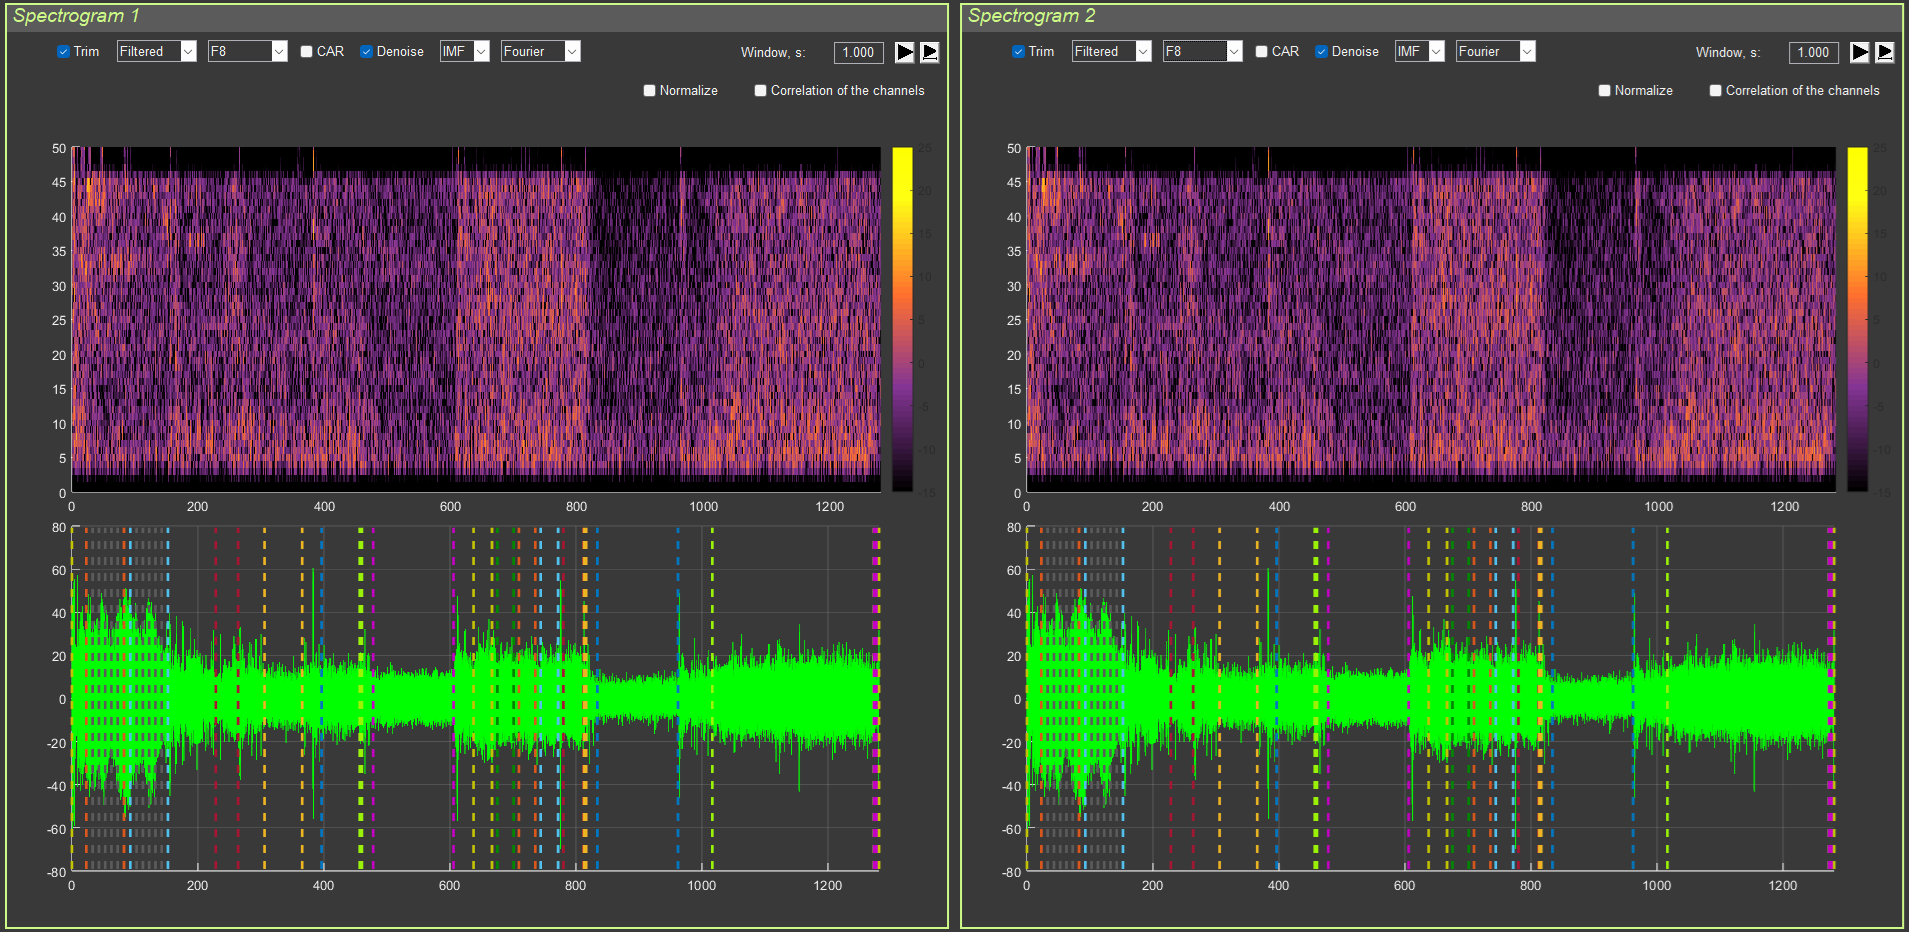
The interface is divided into two panels:

  • Spectrogram 1 (left panel)
  • Spectrogram 2 (right panel)

Each panel contains:

  • A spectrogram (upper graph)
  • A signal time series (lower graph)

Frequency domain interface with two side-by-side panels, Spectrogram 1 and Spectrogram 2, each showing an upper time-frequency spectrogram heatmap and a lower green signal time series, with controls for Trim, filter type, electrode, CAR, Denoise, IMF, Fourier window size, Normalize, and channel correlation.