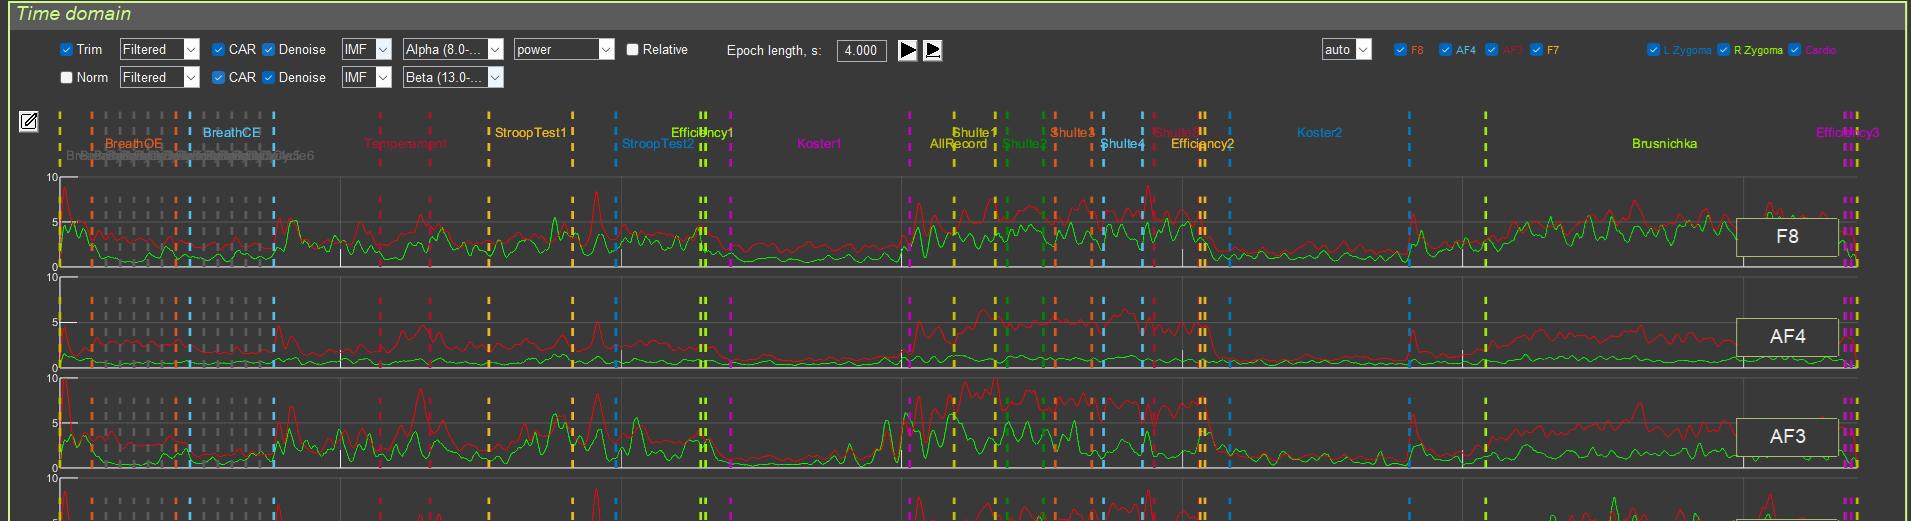

All transformations are applied in the order described in Section 1. For each graph (1 and 2), an independent transformation chain can be specified, which allows different processing methods to be compared.
Example use case:
- Graph 1: Filtered + CAR + Denoise (blink artifacts) + Alpha filter (8–13 Hz) + Power + Epoch length 4 s
- Graph 2: Filtered + CAR + Denoise (blink artifacts) + Beta filter (13–30 Hz) + Power + Epoch length 4 s
This makes it possible to visually compare alpha and beta activity on one screen.