

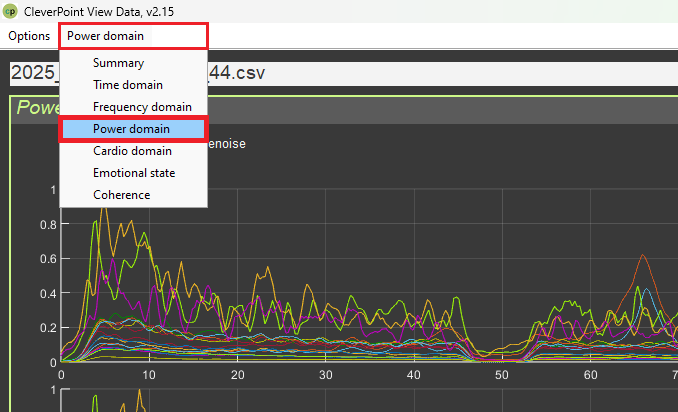
This interface is used to analyze signal power in frequency bands across recording sections. It has two modes:
- Power by sections: a table of power values by section
- Between-channel interactions: a graph of interactions between channels
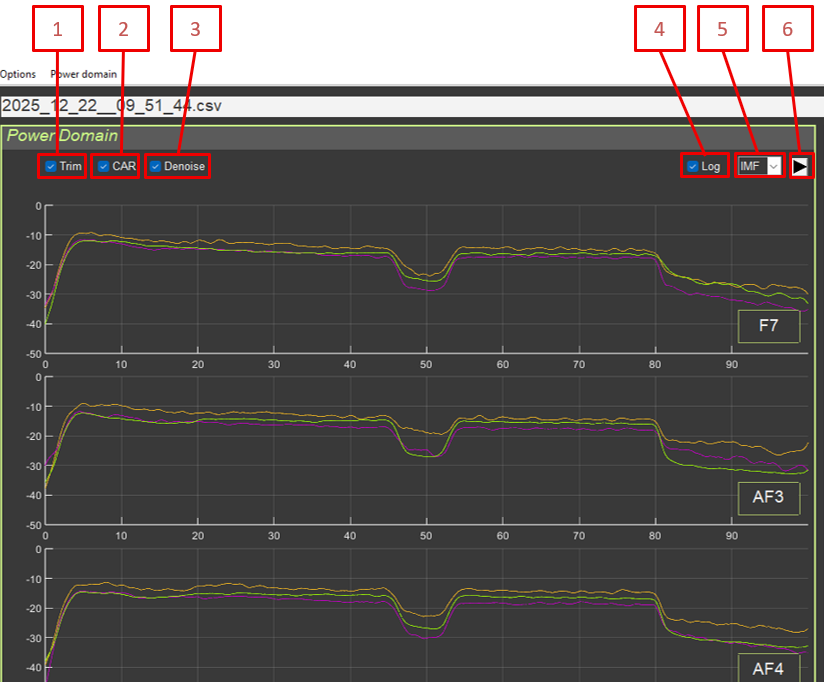
Common controls:
- Trim: Remove artifact segments
- CAR: Common average reference
- Denoise: Blink artifact suppression
- Log: Logarithmic scale
- IMF: EMD mode selection
- Recalculation button